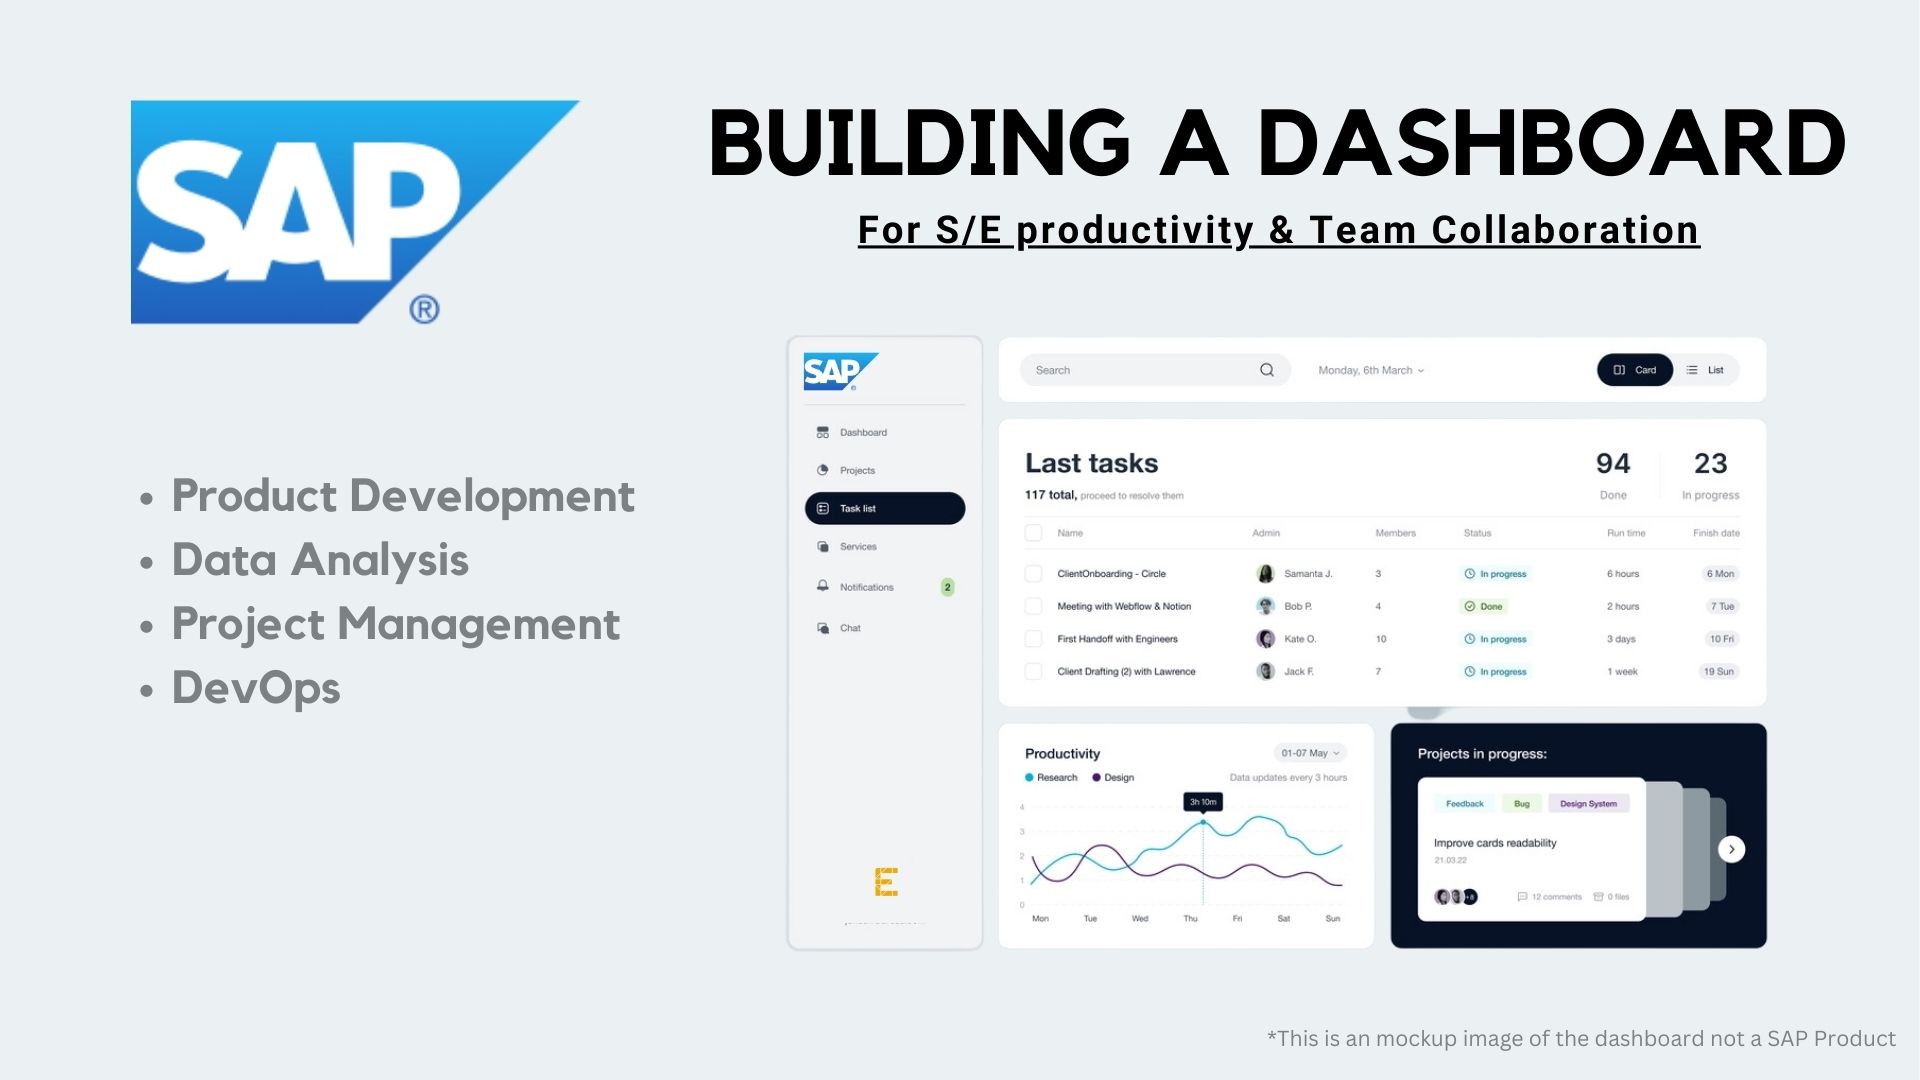
Building a Dashboard for
⚠️ Important Disclaimer: This page does not contain ANY specific or detailed information regarding corporate confidential matters. (All visuals strictly do not reflect the actual client product, data source, and analytic outcomes)
✅ About The Project
The research team of the SAP Labs Newport Beach, CA has assigned a consulting project on building an interactive dashboard for managerial personas, challenges to uplift SAP software developer team by re-designing the sprint monitor dashboard with new features. Team of UCI Data analysts and software engineers collaborates to build an prototype of the dashboard.
Project overview
- Project Goals
- Project Timeline
- Agile & DevOps Methodology Research
- Data Analytics
- Product Development
🎯 Project Goal
The project aims to achieve the following goals:
- Understand the challenges faced by the managers & executives of SAP and identify areas for improvement
- Identify data points that provides real-time insights and actionable information to the managerial personas
- Enhance the user experience by incorporating intuitive features and visualizations
- Improve the productivity of the SAP software developer team by streamlining their sprint monitoring process
- Develop a prototype of the dashboard with SAP that can be tested and refined based on user feedback
📅 Project Timeline
Visualization of the data will unlock the hidden insights from the dataset
The project will be executed over a defined timeline to ensure smooth progress and timely completion. The project timeline is as follows:
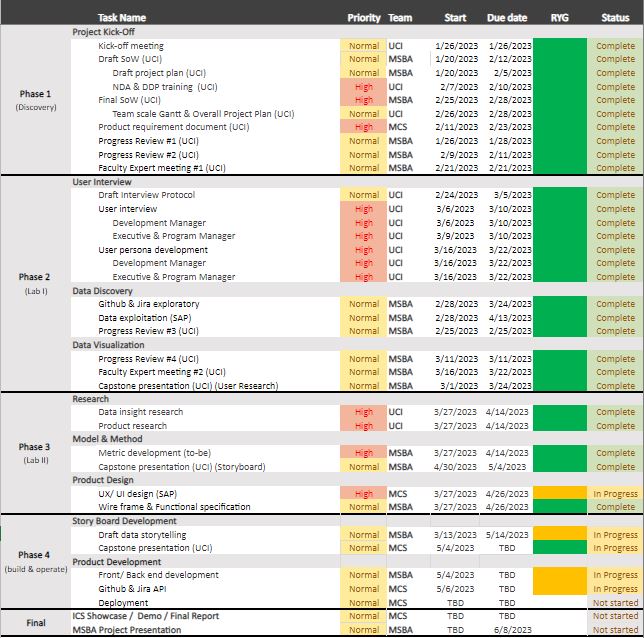
Phase 1: Project kickoff (Discovery Phase)
- Kick off the meeting with all the project stakeholders
- Draft a Statement of Work (SoW) to structure the workflow, define the objective & requirements
Phase 2: User Interview / Data Discovery / Data Visualization (Lab I Phase)
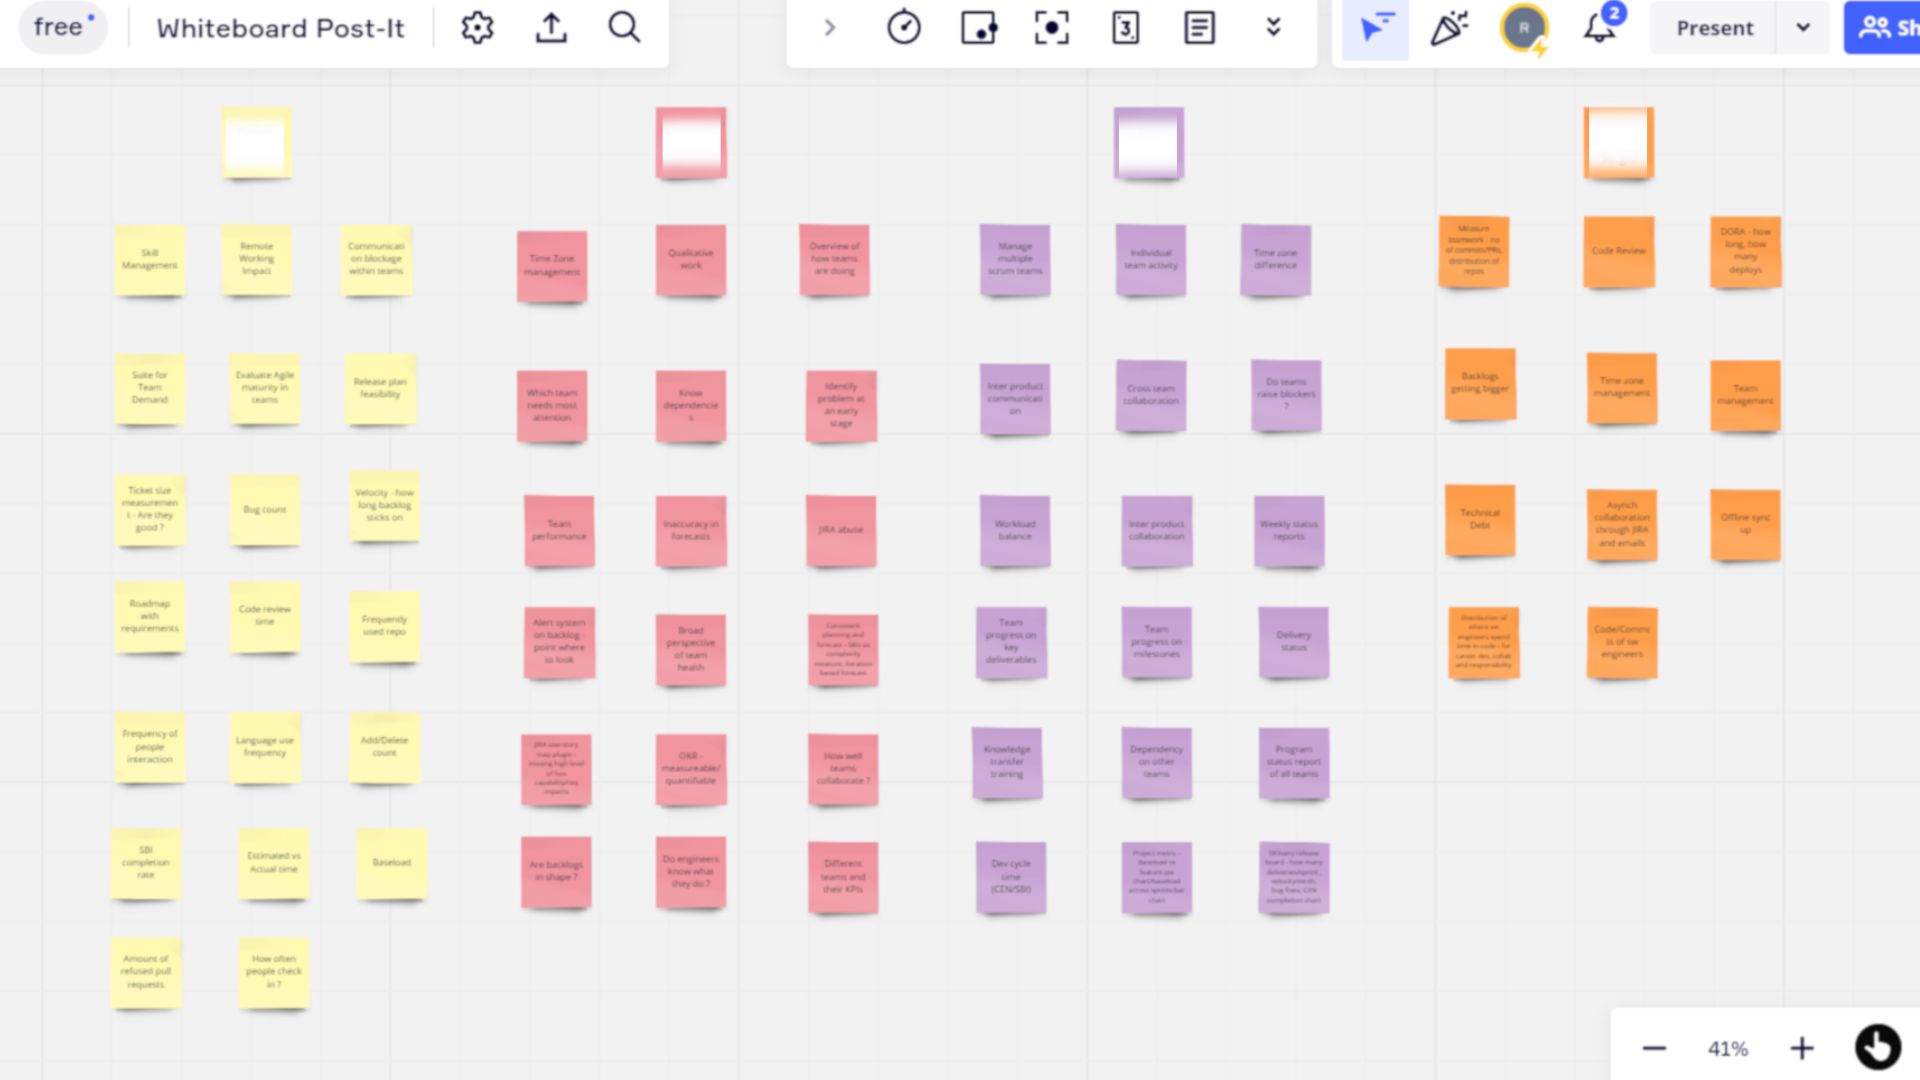
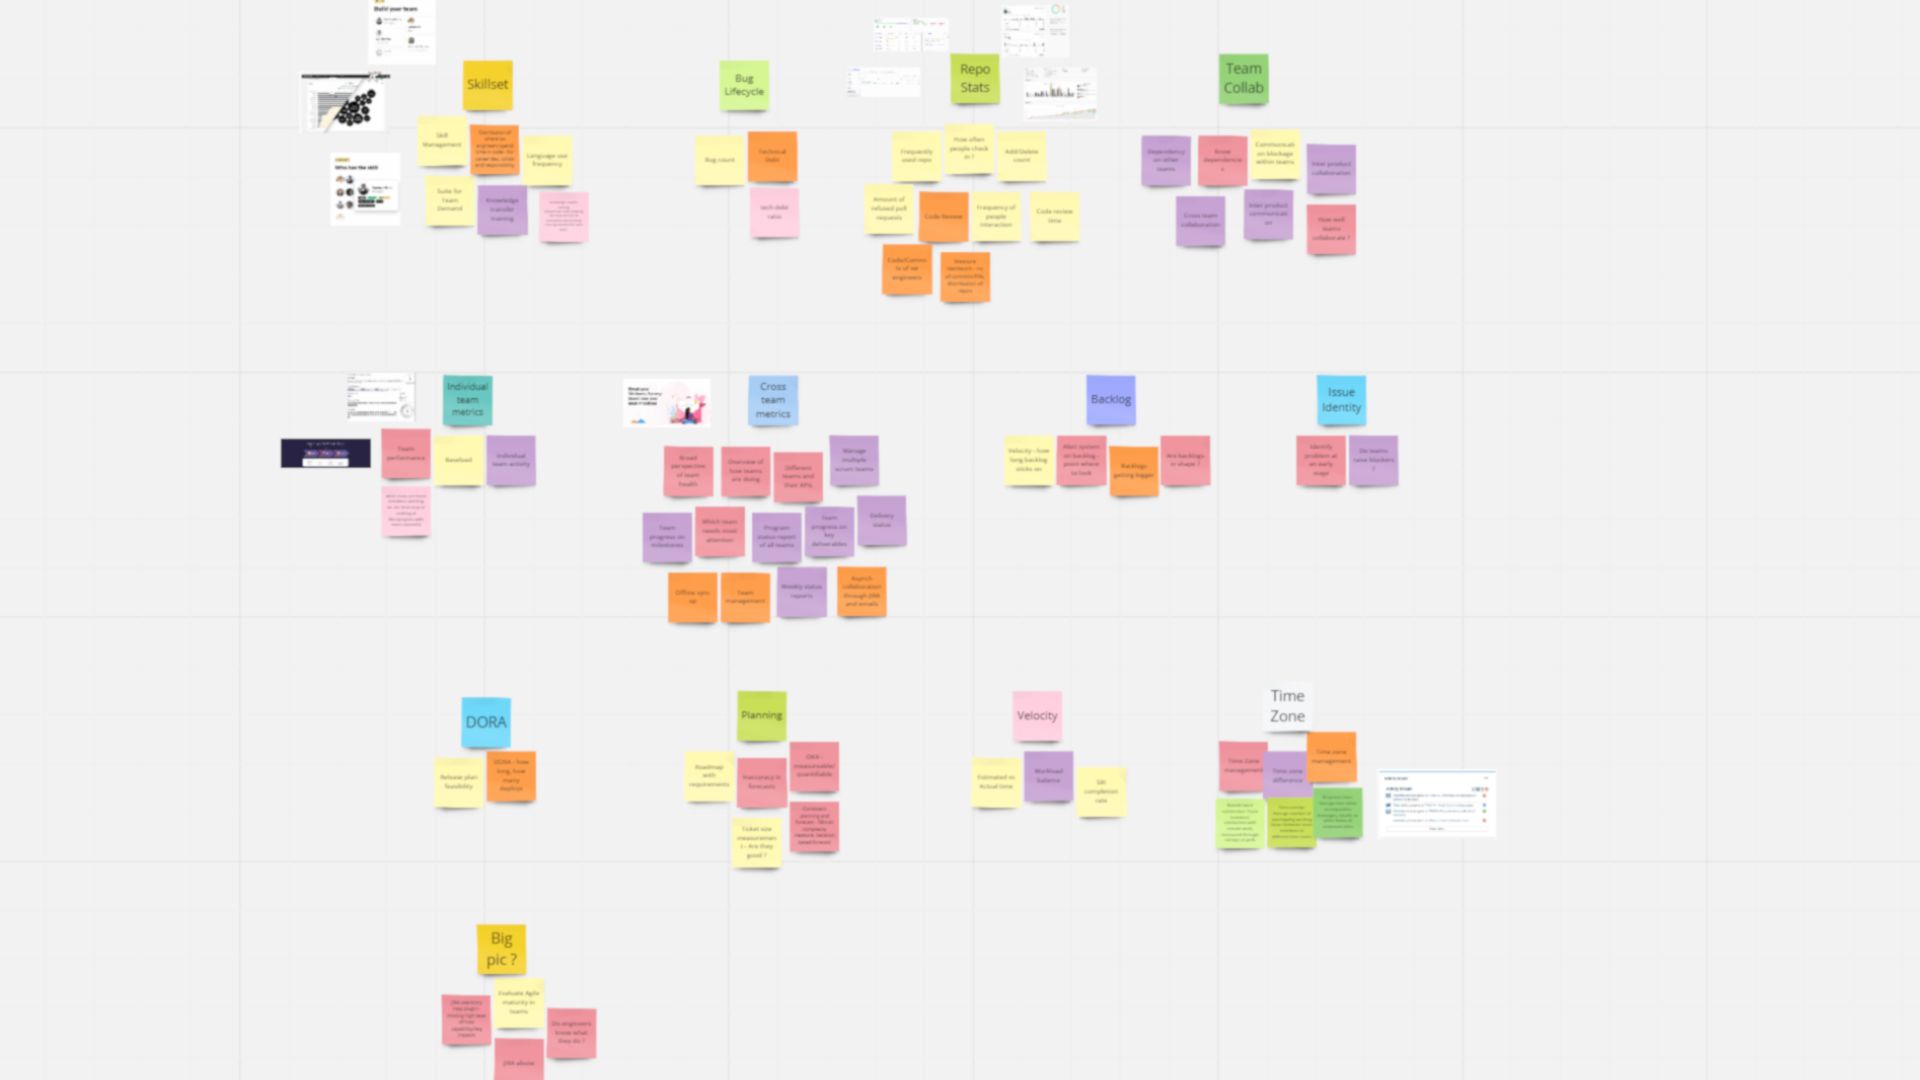
- Conduct qualitative interviews with the SAP managers to understand their challenges and requirements
- Analyze the existing sprint monitor dashboard to identify areas for improvement
- Document the detailed requirements and specifications for the interactive dashboard
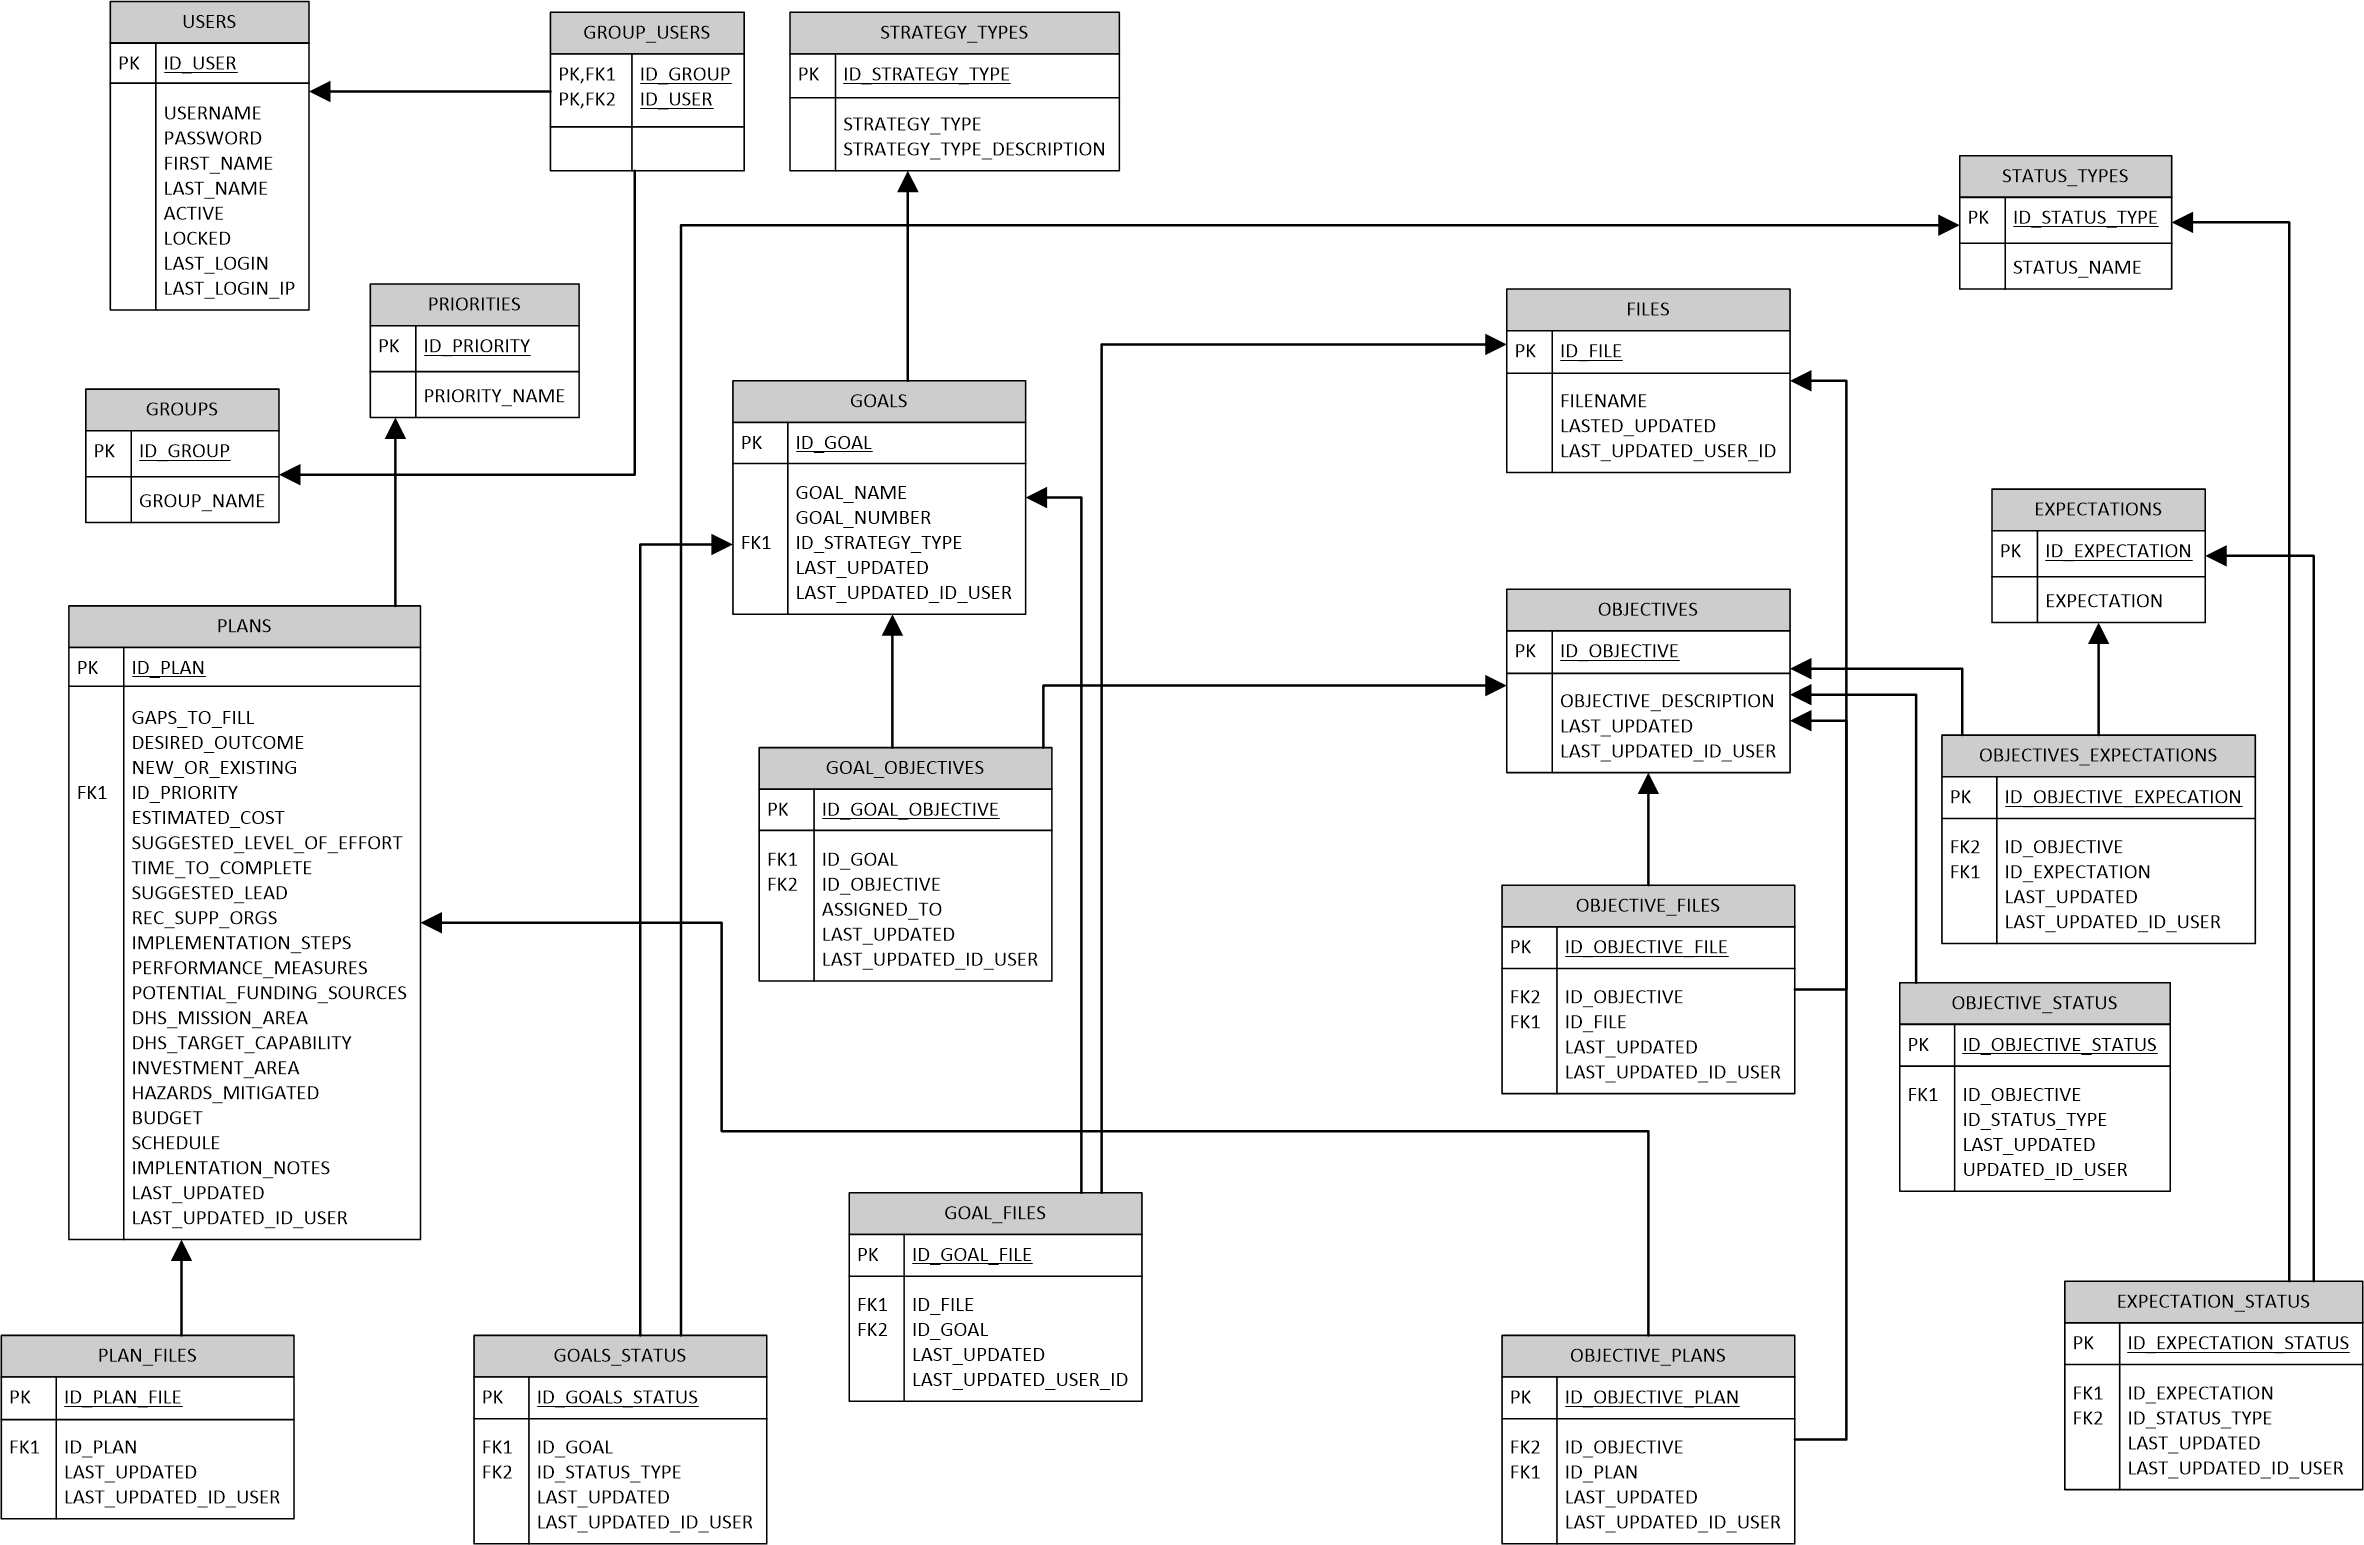
- Build an Entity Relation Diagram (ERD) for the data extraction, visualization & analysis
Phase 3: Research / Model & Method /Product Design (Lab II Phase)
- Research on DevOps & project management methodologies to offer any untouched opportunities
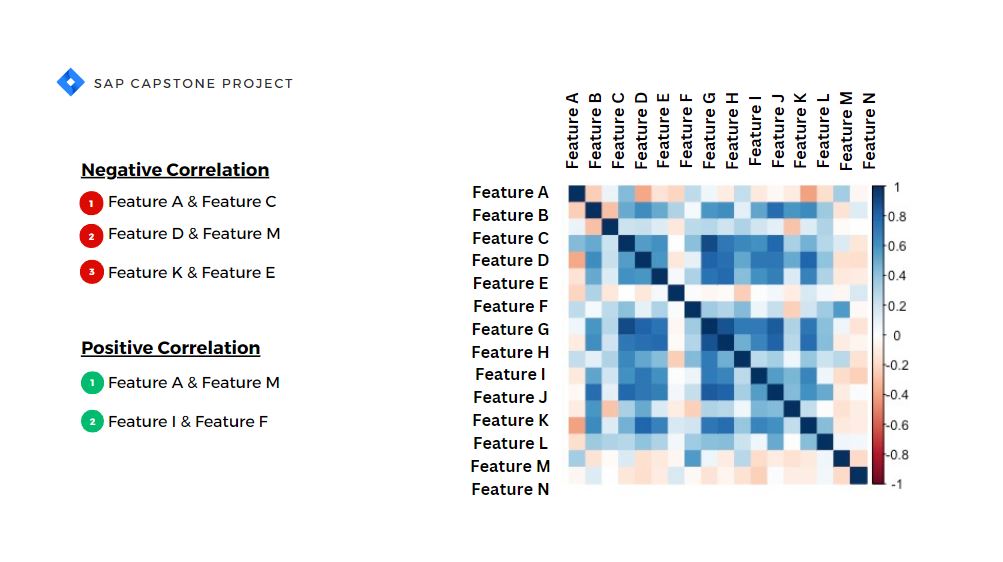
- Run a correlation coefficient analysis & regression model to identify optential feature importance of data
- Continuously improve solutions by validating customer journeys
Phase 4: Story Board Development / Product Development (Build & Opporate Phase)
- Refine requirements jointly between PM and Engineering to ensure common understanding
- Test new functionality with a focus on automation
- Operate services with high reliability and gather feedback
- Conduct user testing sessions with the SAP software developer team and gather feedback on the prototype
- Analyze the feedback and make necessary refinements to improve the dashboard's usability and effectiveness
Final: Showcase / Demo / Final Reporting (Project Closure)
- Incorporate all the required features and enhancements based on user feedback
- Conduct thorough testing to ensure the dashboard's stability and performance
- Prepare the final demo and project presentation of the interactive dashboard for deployment to the SAP
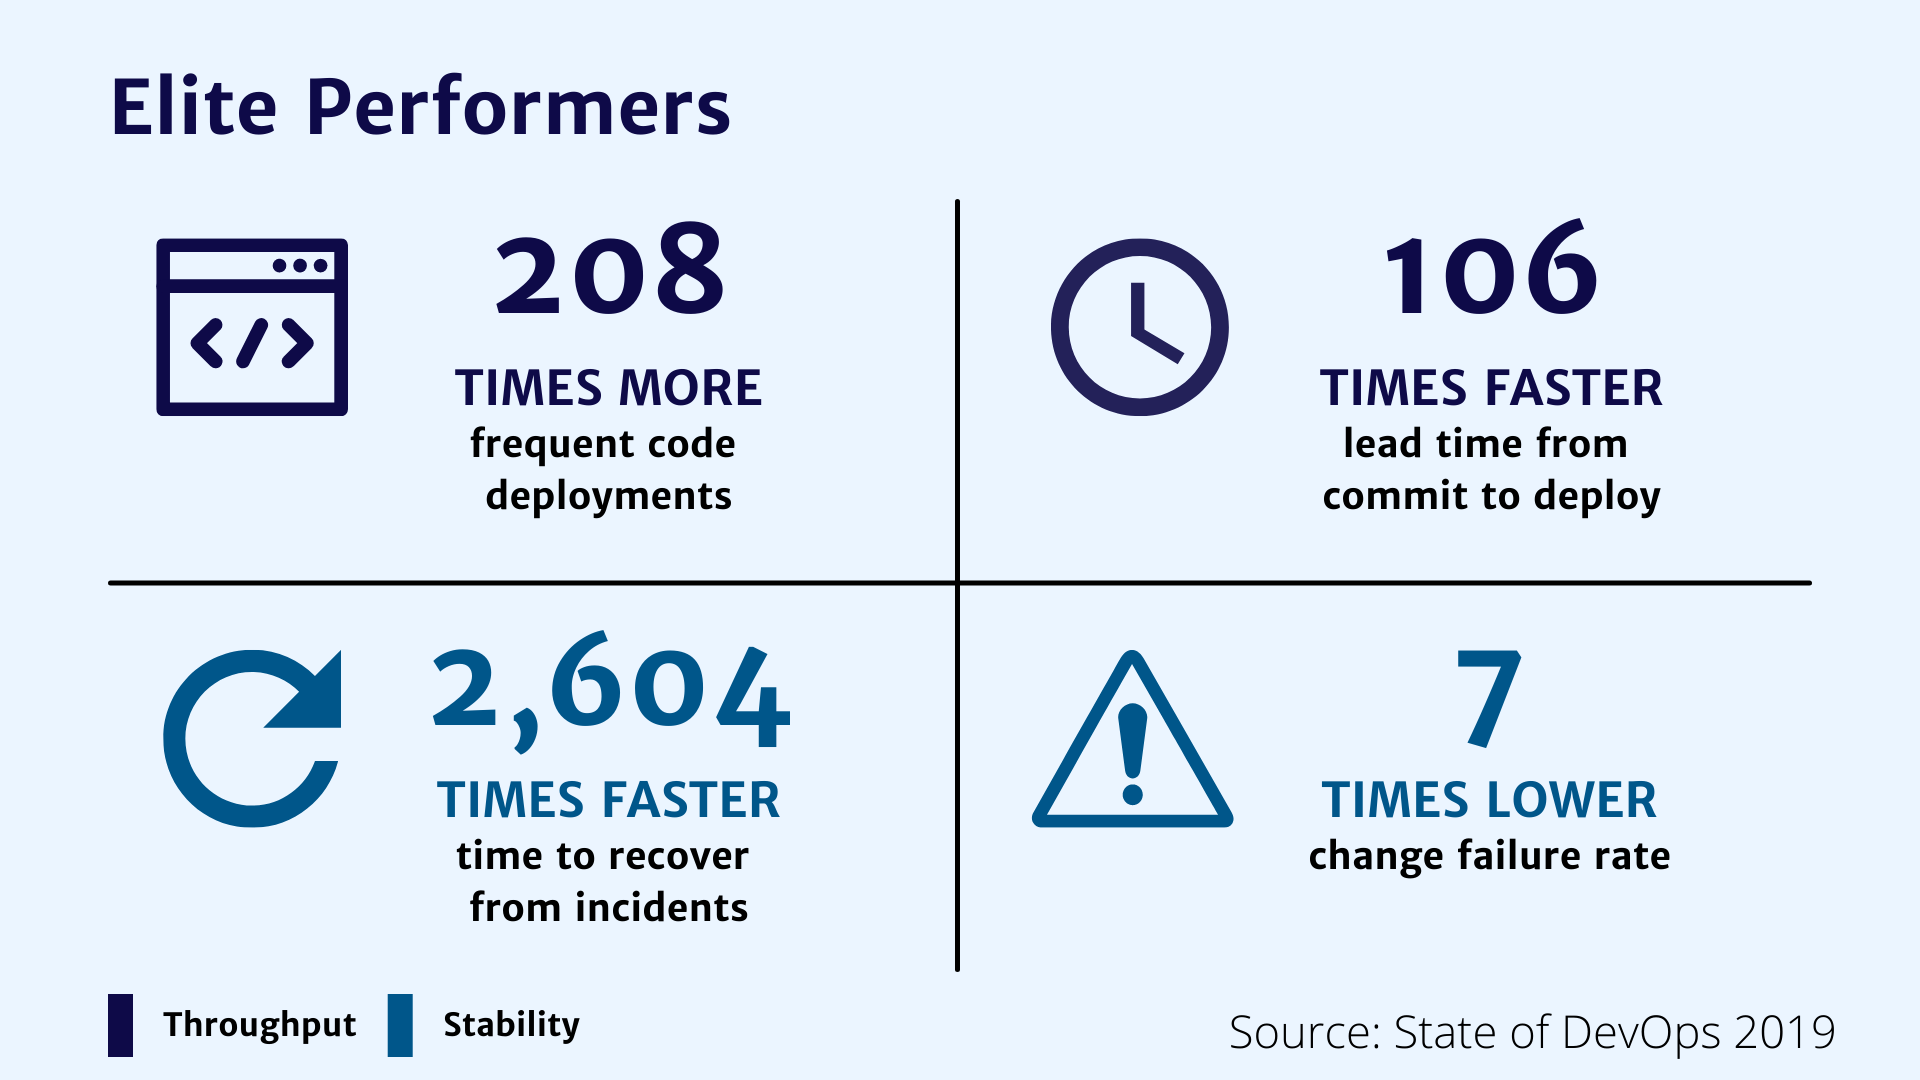
🧐 Agile & DevOps methodologies Research
In-depth research on Development Operations & Agile project managment methodologies in the industry

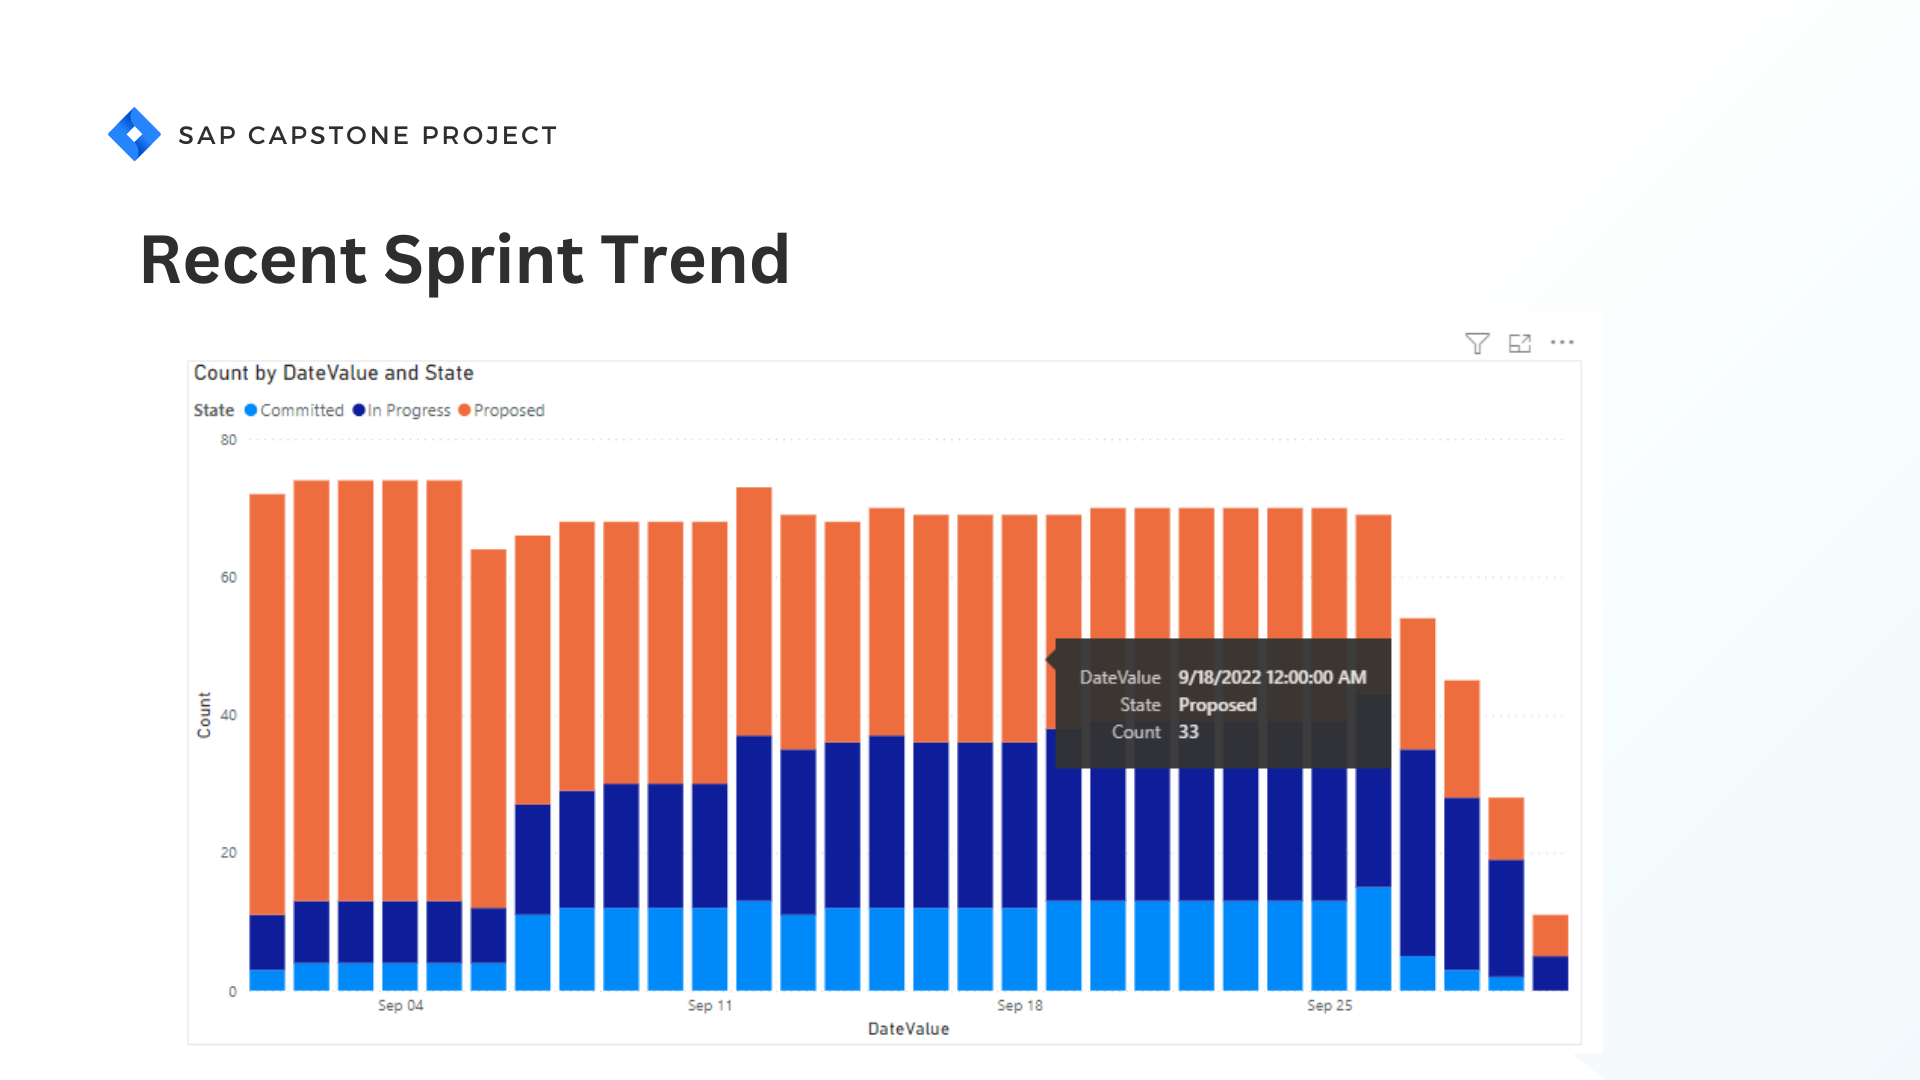
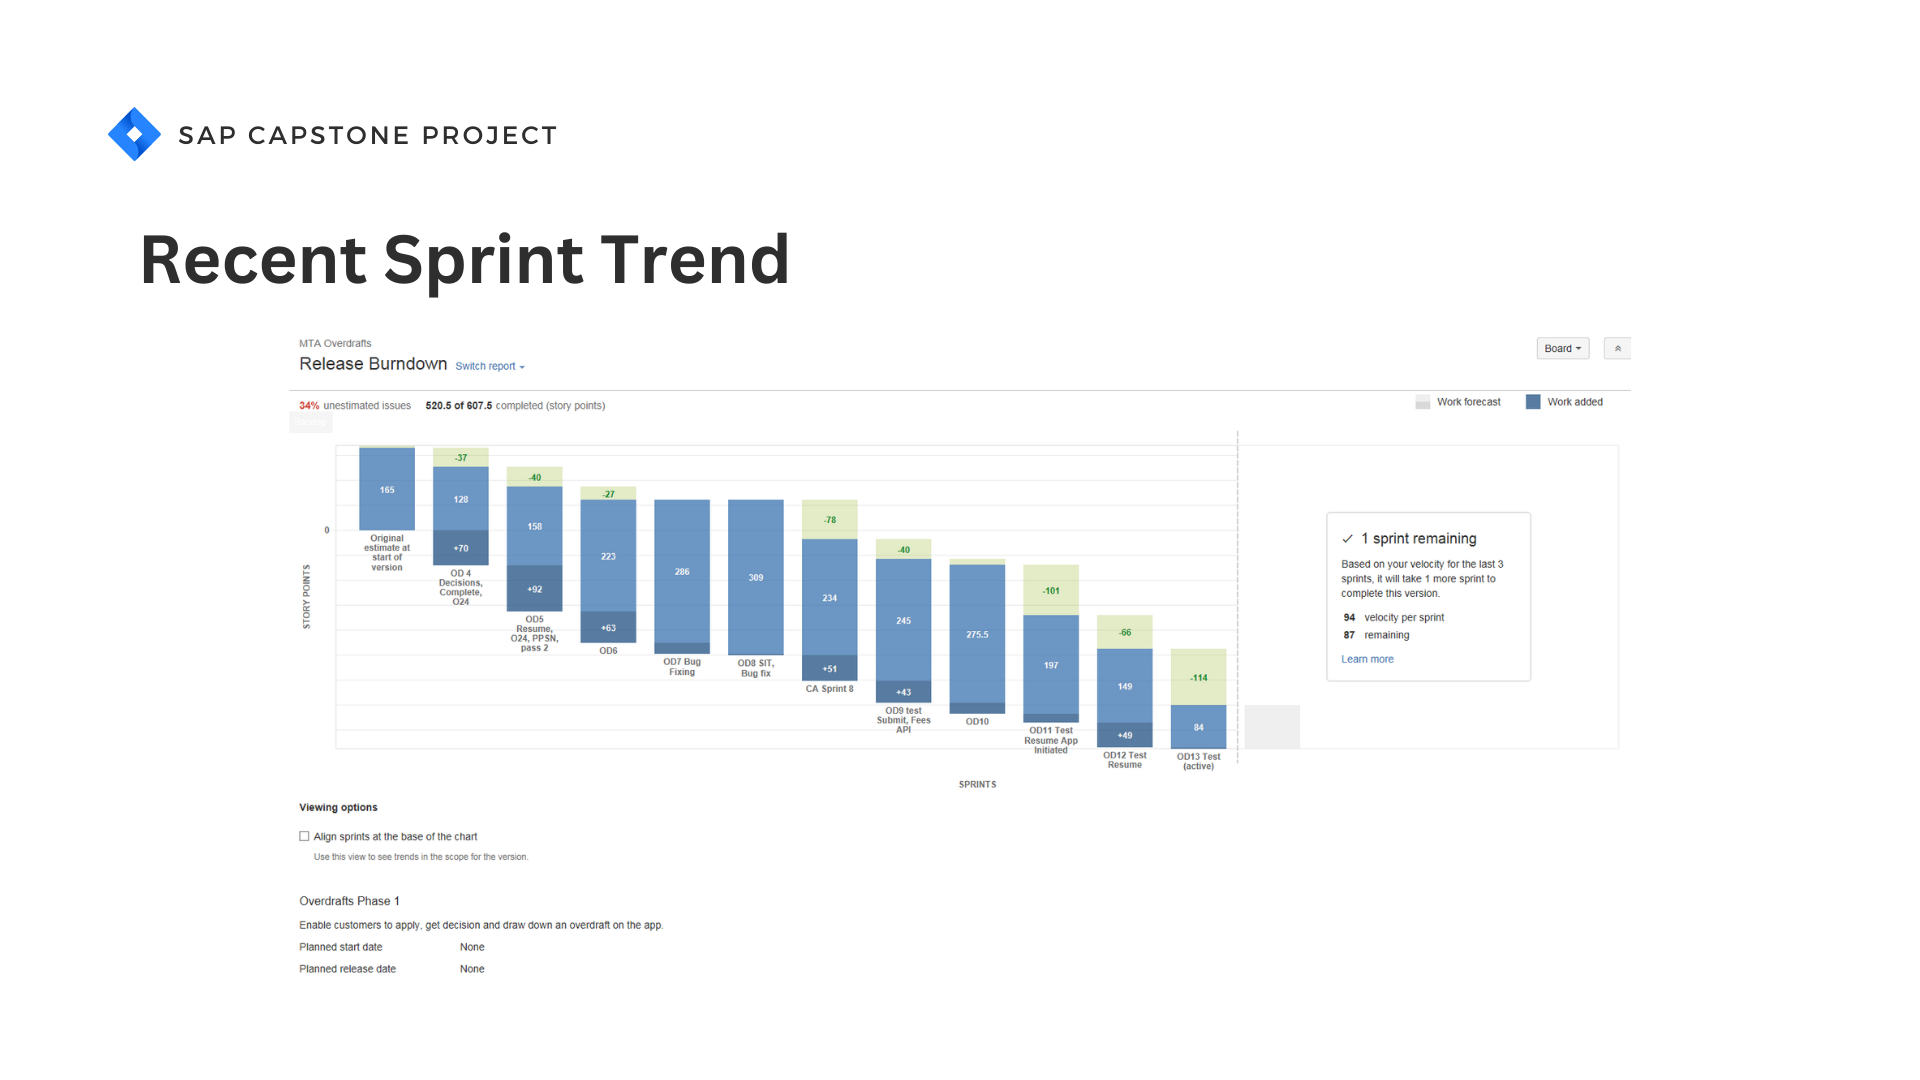
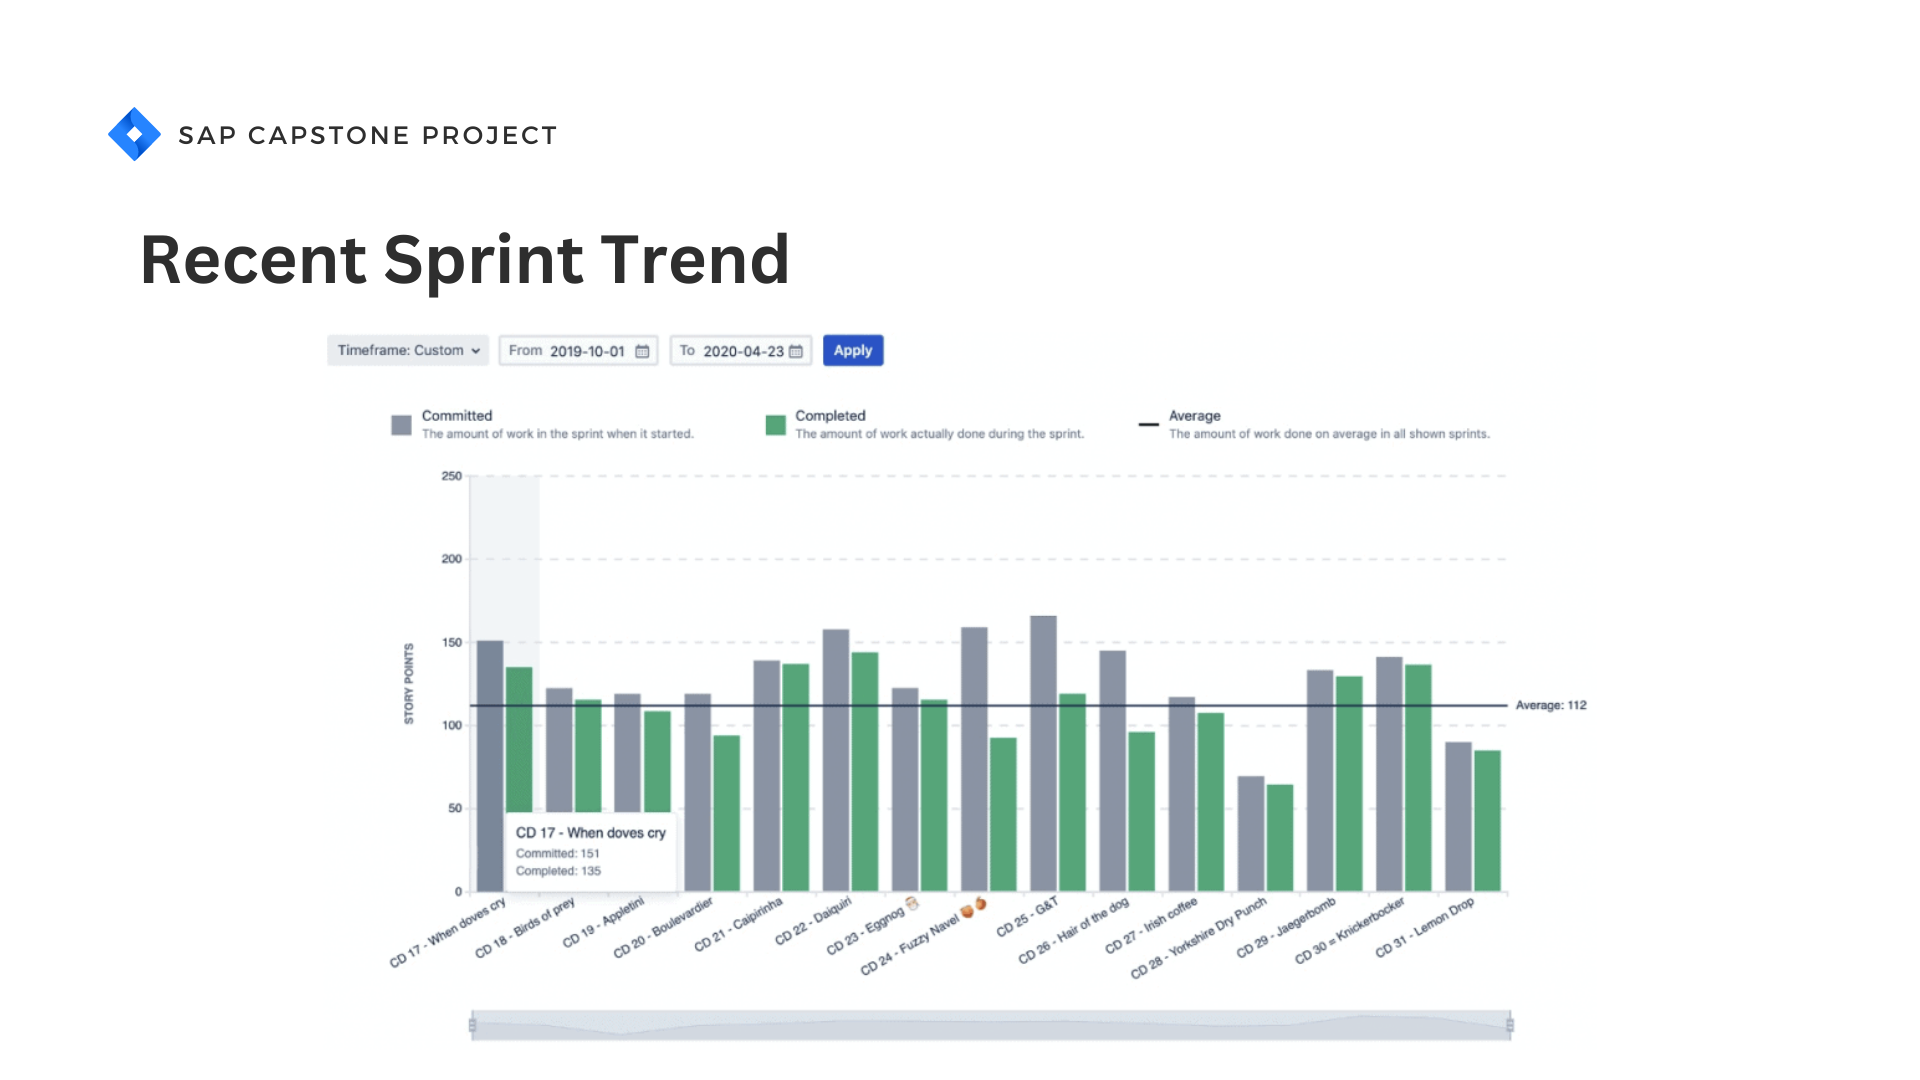
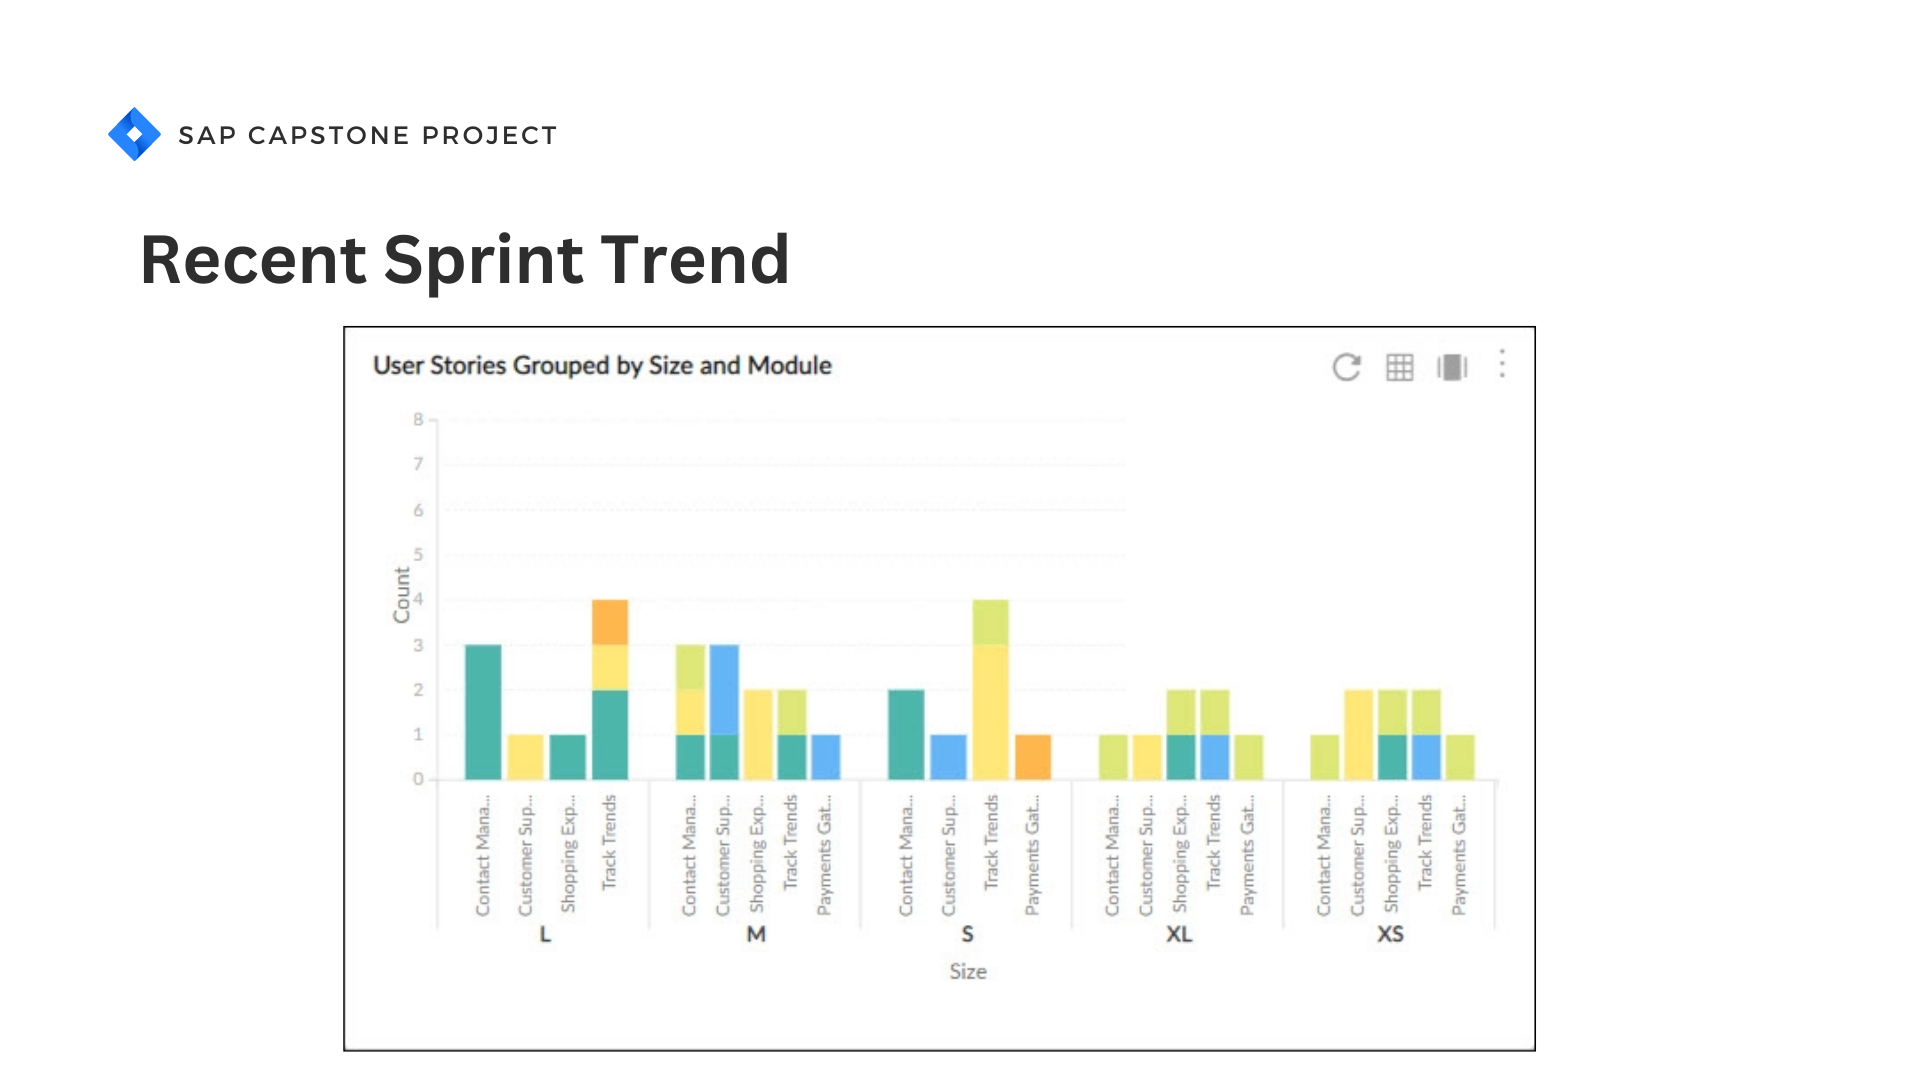
📊 Data Analysis
Designing project dataset & derive the key insights with data analysis/visualization
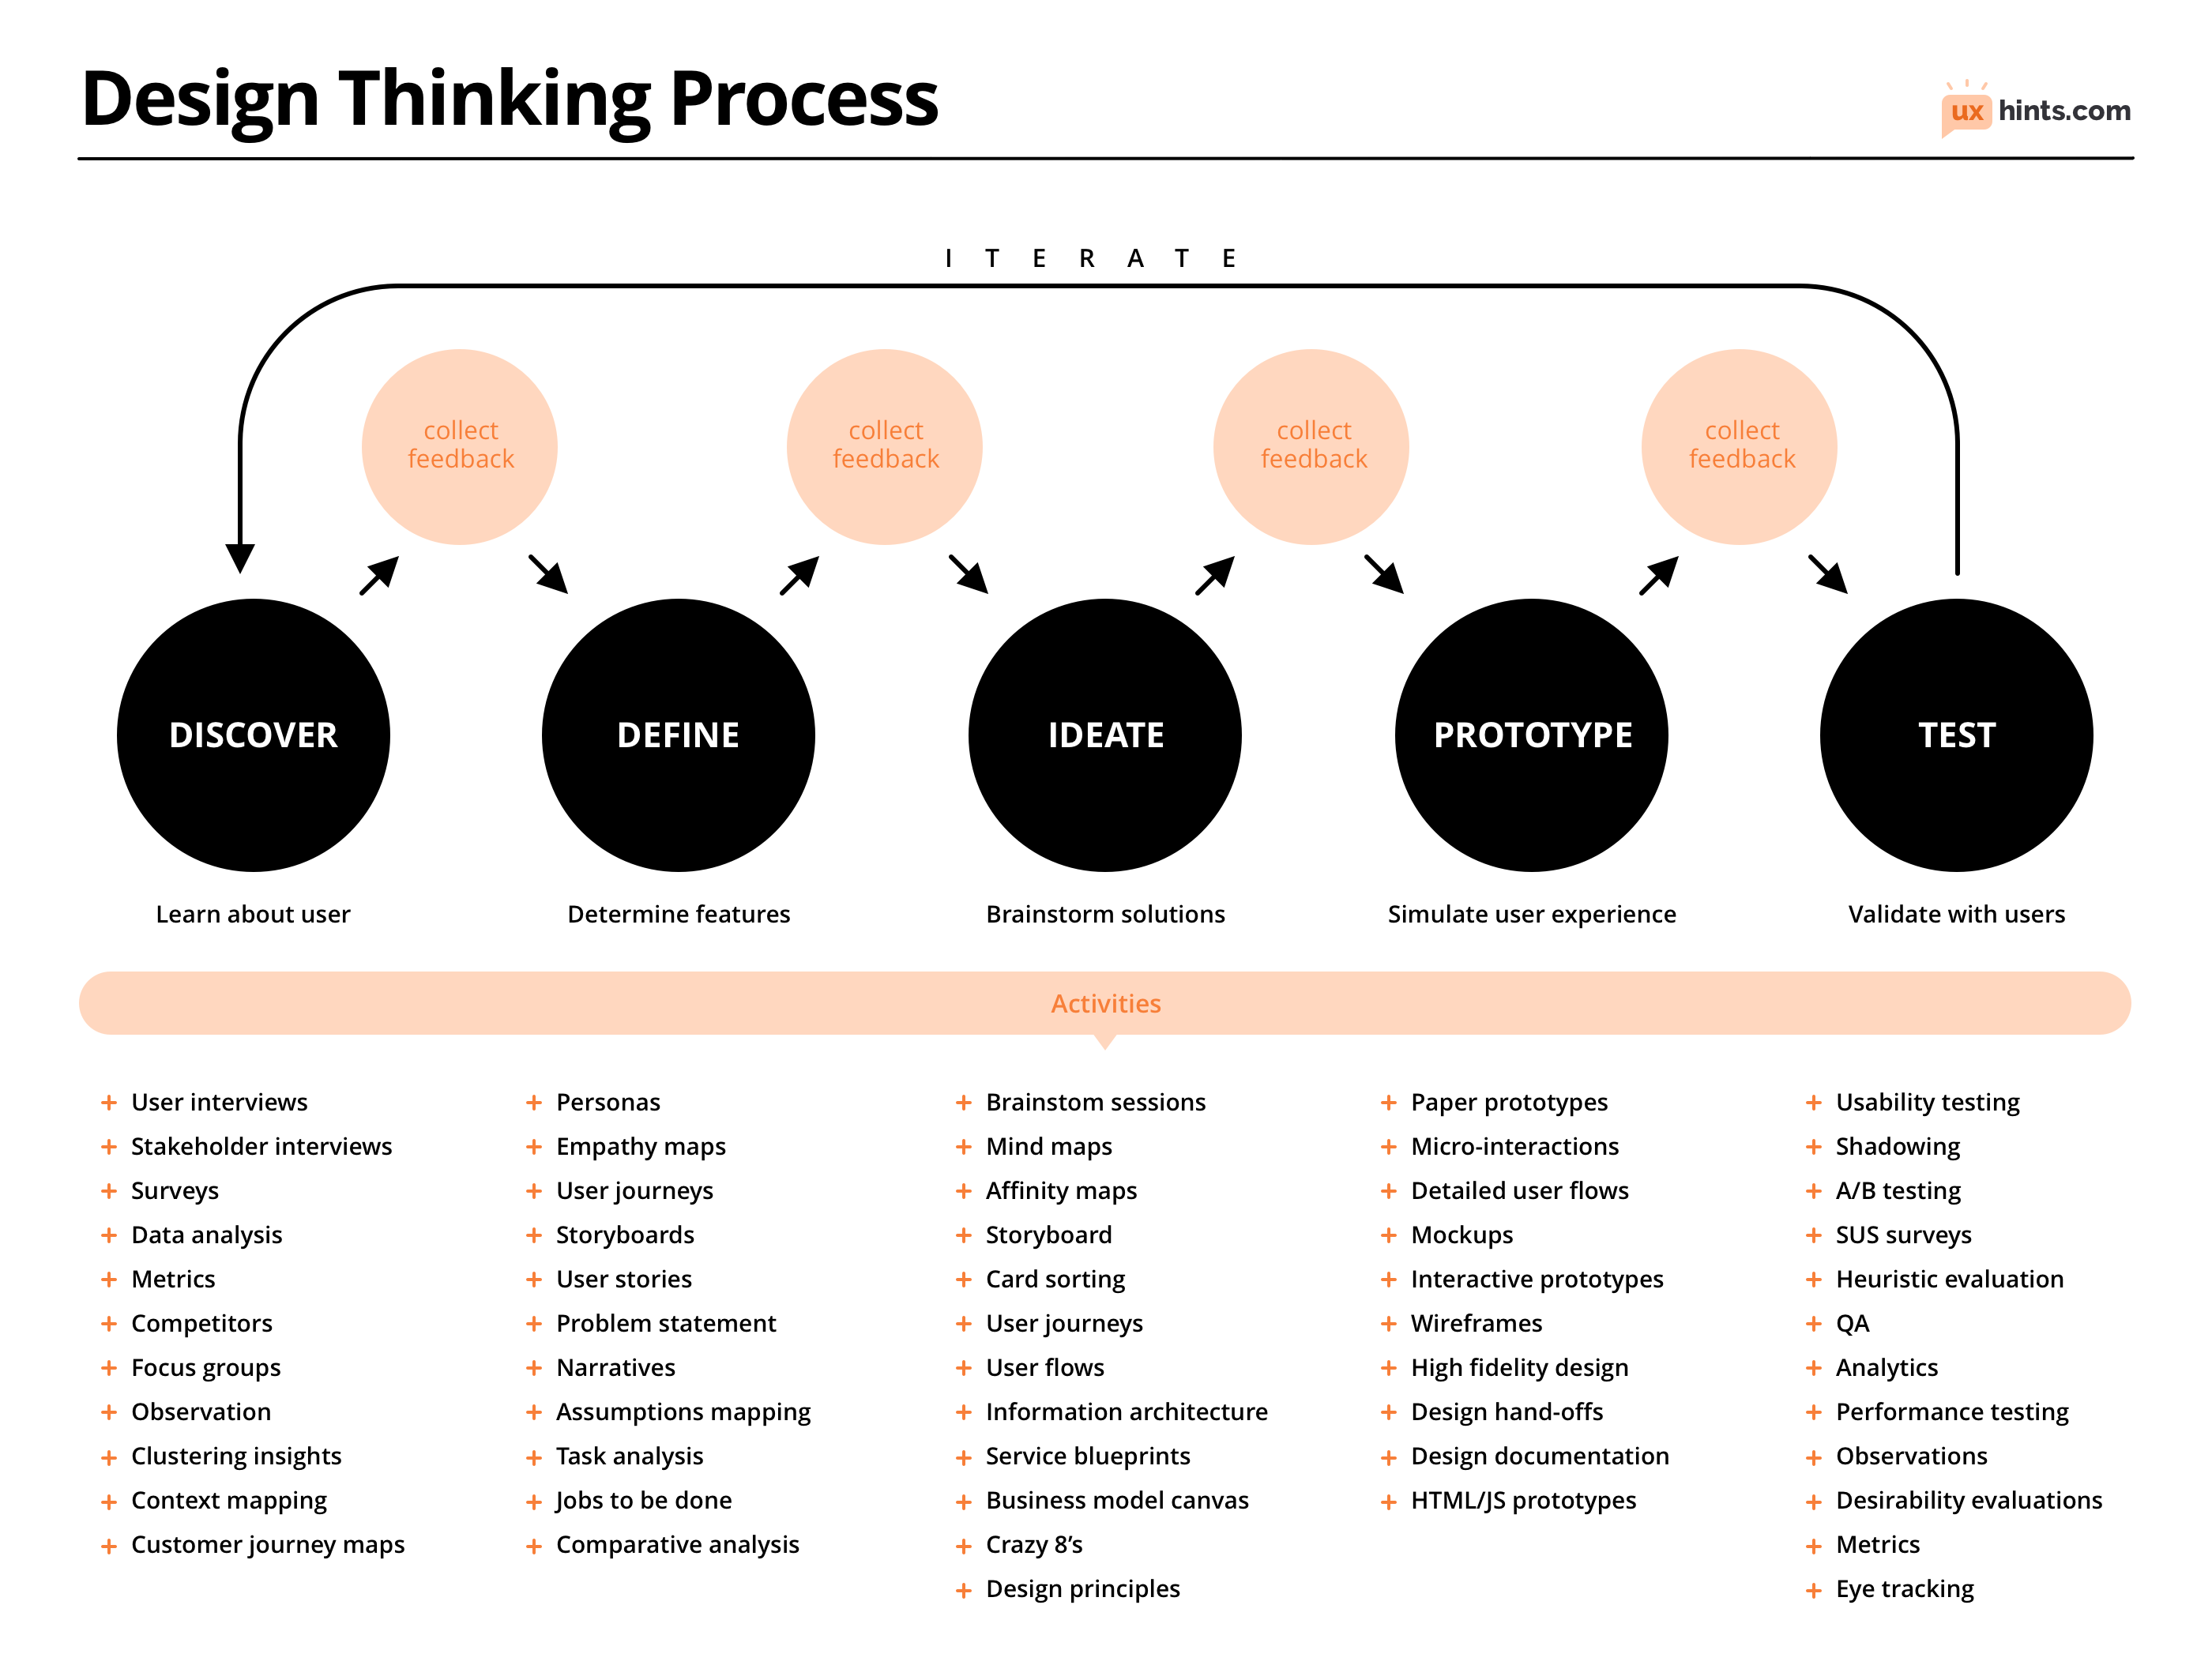
🏗️ Product Development
Applying 'design thinking' process to understand users, challenge assumptions, redefine problems and create innovative solutions to prototype and test
- © haesung Lee
- Have a fabulous day :)